Progressive Web App Compatibility Test
Progressive web app compatibility test for Service Workers, offline storage, installability, push notifications, and background sync validation across browsers.
Browser capability diagnostics for troubleshooting missing WebGL, codec failures, API blocks, configuration problems, extension conflicts, and browser limitations.
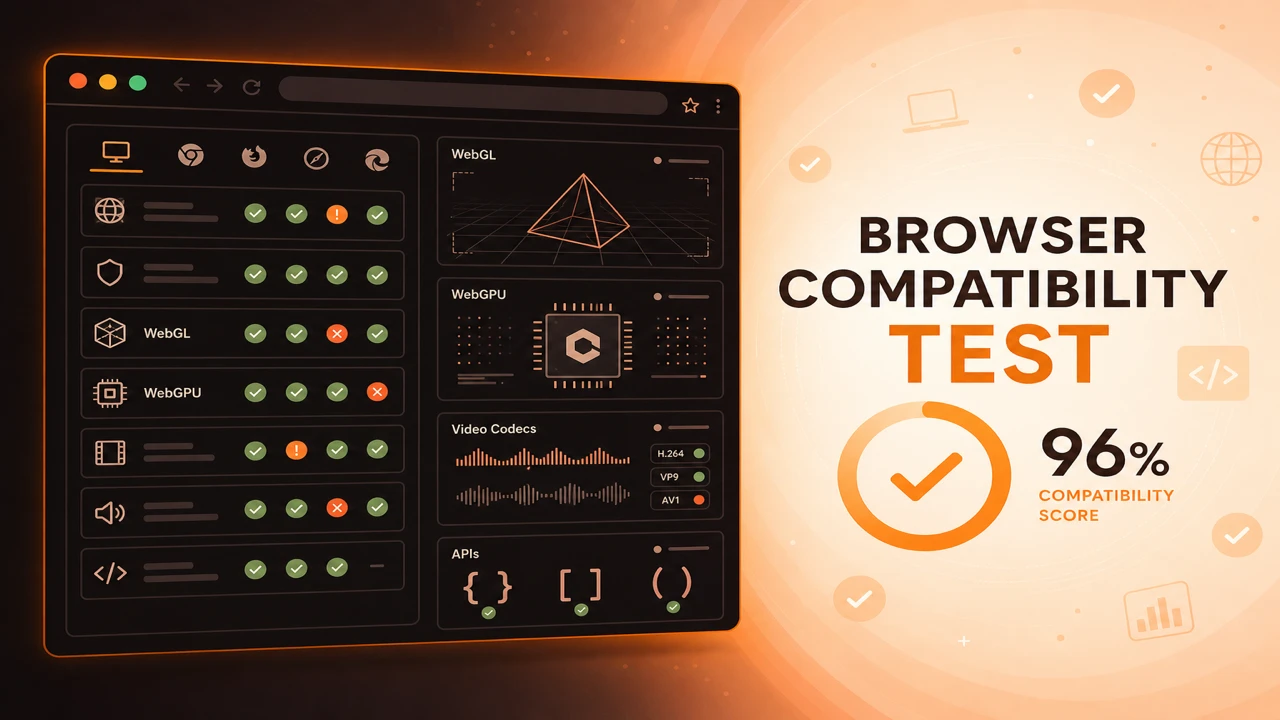
Browser capability diagnostics connect probe failures to likely causes. Missing WebGL often traces to disabled hardware acceleration. Codec failures may reflect platform licensing. API failures frequently involve secure context requirements, enterprise policy, or extension conflicts.
Formula
Root Cause = Failed Probe Category + Environment Context
This article is part of Browser Compatibility Test. Open the compatibility test tool to run WebGL, WebGPU, codec, and API probes in your current browser.
Browser capability diagnostics translate probe failures into troubleshooting guidance for compatibility issues, missing technologies, configuration problems, and browser limitations.
Browser capability diagnostics connect probe failures to likely causes. Missing WebGL often traces to disabled hardware acceleration. Codec failures may reflect platform licensing. API failures frequently involve secure context requirements, enterprise policy, or extension conflicts.
Browser capability diagnostics translate probe failures into troubleshooting guidance for compatibility issues, missing technologies, configuration problems, and browser limitations.
Configuration problems such as HTTP instead of HTTPS, private browsing, and GPU blocklists produce patterns visible across multiple probe categories.
Browser limitations on mobile WebKit and enterprise browsers differ from desktop Chrome, so diagnostics must include environment context.
Users describe symptoms: blank screens, videos that never start, buttons that do nothing. Diagnostics translate those symptoms into specific missing technologies and configuration problems probes can see.
Start by exporting a browser feature availability report from the affected browser so you have a concrete pass and fail matrix before guessing at root cause.
Graphics failures often cluster around disabled hardware acceleration, GPU blocklists, and remote desktop environments. Media failures frequently involve codec licensing, DRM, or container mismatches rather than absent APIs.
API failures commonly trace to missing secure contexts, private browsing limits, or enterprise policy blocks on storage and workers.
When graphics probes fail but codecs pass, run a hardware acceleration test to learn whether software rendering or policy-blocked GPUs explain the symptom before changing application code.
Diagnose by category first: graphics failures cluster around GPU policy, media failures around codecs and DRM, API failures around secure context and permissions.
Compare the failing browser against a known-good report using the same probe scope before chasing application bugs.
Compare failing sessions against a known-good export from the same browser family on unrestricted hardware. The diff often isolates policy or configuration instead of defects.
Root Cause = Failed Probe Category + Environment Context
Apply these steps in order so compatibility results stay comparable across browsers and releases.
Capture probe output
Export JSON when a user reports blank screens, codec errors, or missing features.
Identify failure category
Group failures into graphics, media, or APIs to narrow troubleshooting focus.
Check environment context
Review secure context, private mode, remote desktop, and hardware acceleration settings.
Compare known-good session
Diff against a passing report from the same browser family on unrestricted hardware.
Document resolution
Record whether policy change, browser upgrade, or application fallback resolved the issue.
Users report a blank 3D viewer. Diagnostics show WebGL failure with software renderer on managed PCs. IT re-enables GPU access and probes pass on retest.
An API probe fails for Service Worker on HTTP staging. Diagnostics confirm missing secure context. Moving to HTTPS resolves the issue without code changes.
Users report a blank 3D viewer. Diagnostics show WebGL failure with software renderer strings on managed PCs. IT re-enables GPU access and probes pass on retest.
Service Worker probes fail on HTTP staging. Diagnostics confirm missing secure context. Moving to HTTPS resolves the issue without code changes.
Capability diagnostics turn abstract user complaints into specific missing technologies and configuration problems.
Teach support staff to request exported probe JSON alongside browser version and OS details.
Run Capability Diagnostics
PWA
Progressive web app compatibility test for Service Workers, offline storage, installability, push notifications, and background sync validation across browsers.
Reporting
How to build a browser feature availability report from probe sessions. Document supported, unsupported, and experimental WebGL, codec, and API capabilities.
Performance
Hardware acceleration test guide for GPU graphics, video decode, and rendering paths. Diagnose software rendering, blocked GPUs, and browser optimization issues.